How to Make Realistic Mountain Views from SVG Line Graphs in 2025
Transform SVG line data into stunning 3D mountain landscapes using AI. Complete guide to depth mapping, texture application, and ComfyUI workflows for...
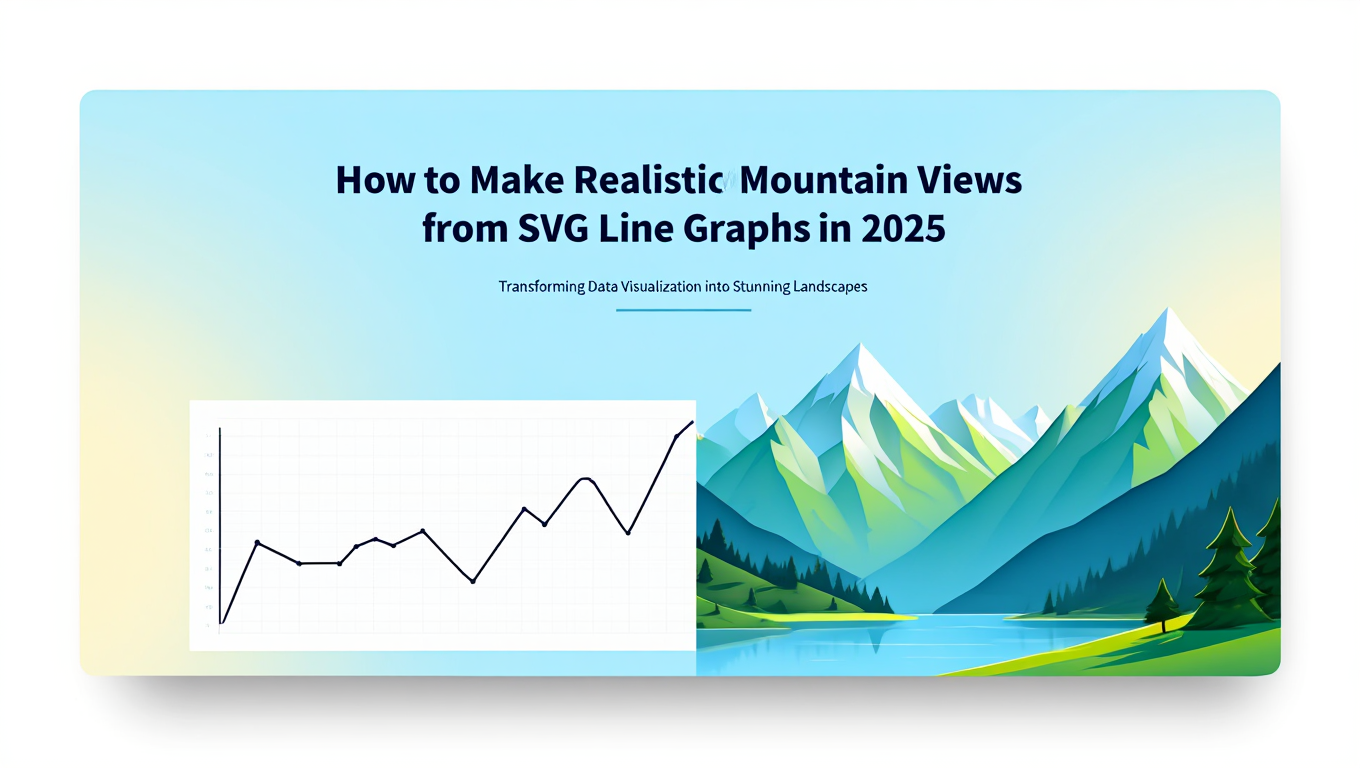
I was playing with stock market data visualization and thought "wouldn't it be wild if these peaks and valleys were actualactually... mountains?" Just a random shower thought. But then I couldn't stop thinking about it.
Exported the graph as SVG, converted it to a depth map, threw it into ComfyUI with ControlNet depth, and 2 minutes later I had a photo realistic mountain range that exactly matched my stock chart topology. Market crashes were valleys, growth periods were peaks. It looked incredible and told the story way better than any boring line graph.
Turns out this works for any line-based data. Audio waveforms become mountain ranges. Financial charts become spaces. Elevation profiles become... well, actual elevations.
Quick Answer: To transform SVG to mountain space imagery, extract the path coordinates as depth map data, import this data into ComfyUI or similar AI image generation tools, use the depth information to guide terrain generation with ControlNet, then apply photorealistic textures and lighting through img2img workflows with space-focused models. This SVG to mountain space technique enables precise control over terrain topology.
- SVG path data can be directly converted into grayscale depth maps that AI models interpret as terrain elevation
- ControlNet depth processors in ComfyUI allow precise control over mountain shape and structure from your line data
- Combining depth control with photorealistic space models produces results that match your original graph topology
- This technique works for financial charts, elevation profiles, audio waveforms, or any line-based data visualization
- Tools like Apatero.com simplify this entire workflow into a single-click process without manual ComfyUI setup
Why Would You Convert SVG to Mountain space?
The intersection of data visualization and artistic terrain generation opens fascinating creative possibilities that extend far beyond simple novelty. Data artists and creative professionals increasingly use this SVG to mountain space technique to transform abstract numerical information into emotionally resonant visual experiences. Understanding why SVG to mountain space conversion works helps you use it effectively.
Financial analysts create memorable annual reports by converting stock performance charts into literal market spaces, where peaks represent growth periods and valleys show downturns. This metaphorical visualization helps non-technical stakeholders grasp complex trends intuitively. Music producers visualize audio waveforms as mountain ranges for album artwork, creating a direct physical representation of sound topology that resonates with listeners.
Game developers and world builders use real elevation data exported as SVG to generate consistent terrain that matches geographical reference materials. When you need a mountain range that follows actual topographical patterns from Earth locations, starting with SVG elevation profiles ensures accuracy while maintaining creative control. Scientific communicators transform climate data, seismic readings, or astronomical measurements into space art that makes abstract concepts tangible and memorable.
The technical advantage of SVG to mountain space conversion lies in the precise control SVG data provides. Unlike purely random terrain generation, your source graph determines exact peak heights, valley depths, and slope gradients. This deterministic SVG to mountain space approach means you can iterate on the artistic rendering while preserving the underlying data accuracy. While platforms like Apatero.com offer instant SVG to mountain space conversion without technical complexity, understanding the underlying process helps you achieve exactly the result you envision. If you're new to ComfyUI, our ComfyUI basics and essential nodes guide will help you get started with the fundamentals.
What Tools Do You Need for SVG to Mountain space Conversion?
Successfully transforming SVG to mountain space requires a specific combination of vector editing capabilities, image processing tools, and AI generation platforms. The SVG to mountain space technical stack might seem intimidating initially, but each component serves a distinct purpose in the conversion pipeline. Mastering these tools enables professional SVG to mountain space results.
Vector Editing Software
You'll need tools to extract and manipulate SVG path data. Inkscape provides free, open-source functionality for isolating line elements, converting objects to paths, and exporting coordinate data. Adobe Illustrator offers more refined control for complex graphs with multiple data series, though it's overkill for simple conversions. For programmatic approaches, Python libraries like svgpathtools or xml.etree allow direct parsing of SVG files to extract numerical coordinates without manual intervention.
Depth Map Generation
The critical intermediate step involves converting your line data into a grayscale depth map where brightness represents elevation. GIMP or Photoshop work for manual creation by painting white-to-black gradients below your line curve. Python with PIL or OpenCV enables automated generation by iterating through Y-coordinates and filling pixels based on height values. The resulting image should show white peaks where your line graph reaches maximum values and black valleys at minimum points, with smooth gradients representing slopes.
ComfyUI and ControlNet
ComfyUI serves as the primary AI generation platform for this workflow. You'll specifically need the ControlNet depth preprocessor nodes installed, which interpret your depth map as three-dimensional elevation data. The Stable Diffusion checkpoint you choose matters significantly. Realistic Vision, DreamShaper, or space-specialized models like LandscapesXL produce better terrain results than general-purpose checkpoints. Your depth map connects to the ControlNet conditioning input, allowing the AI to generate images that respect your specified topology.
Alternative Approaches
Blender offers a completely different path by importing your depth map as a displacement modifier on a subdivided plane mesh. This creates actual 3D geometry you can light, texture, and render with photorealistic materials. The learning curve is steeper, but the control is absolute. For those wanting to avoid technical setup entirely, Apatero.com provides pre-configured workflows that handle depth extraction, AI generation, and texture refinement through a simplified interface requiring no software installation.
Hardware considerations include GPU memory for running local ComfyUI workflows. A minimum of 8GB VRAM handles basic generations, while 12GB or more allows higher resolution outputs and larger models. Cloud-based solutions bypass these requirements but introduce per-generation costs instead of one-time hardware investment.
How Do You Extract Usable Depth Data for SVG to Mountain space?
The conversion from vector line data to raster depth information forms the critical foundation of the SVG to mountain space technique. This process determines how faithfully your final SVG to mountain space represents the original graph topology, so understanding the nuances prevents disappointing results.
Manual Extraction in Vector Editors
Open your SVG file in Inkscape and isolate the primary line element you want to convert. Remove axes, labels, gridlines, and any decorative elements that don't represent actual data. Select your target line and convert it to a path if it isn't already using Object to Path. Now comes the key step creating the filled area under the curve. Duplicate your line, then use the Bezier tool to close the bottom by connecting the endpoints along the X-axis baseline. Fill this closed shape with a white-to-transparent gradient where white sits at the line peaks and transparency at the baseline.
Export this as a PNG with a black background. The resulting image shows your data as a brightness map where taller peaks appear brighter. For multi-series graphs with several lines representing different data sets, treat each series as a separate depth layer or blend them into a composite height field by overlaying with partial transparency.
Programmatic Python Approach
For reproducible workflows or batch processing, Python offers powerful automation. Parse the SVG using xml.etree to extract path d attribute strings containing coordinate pairs. Convert these path commands into numerical arrays using the svgpathtools library. Create a blank numpy array matching your desired depth map resolution, typically 512x512 or 1024x1024 pixels.
Iterate through your coordinate data, mapping X-values to horizontal pixels and Y-values to pixel brightness. For each vertical column of pixels, fill from the bottom up to the Y-coordinate with a brightness value, creating the solid fill under the curve. Apply Gaussian blur to smooth the gradient between elevation changes. Save the result as a grayscale PNG using PIL. This programmatic method handles complex graphs with thousands of data points that would be tedious to process manually.
Handling Complex Topologies
Real-world data often includes noise, gaps, or irregular sampling that creates problematic depth maps. Apply smoothing algorithms to reduce sharp discontinuities that appear as unnatural cliffs in the final render. For graphs with negative values, shift the entire dataset into positive range by adding an offset, or use a middle-gray baseline instead of black for zero values. Multiple overlapping lines require decision logic about whether peaks should combine additively or the highest value should take precedence at each X-position.
Financial time series data often spans orders of magnitude. Logarithmic scaling prevents one extreme outlier from compressing all other variation into a flat plateau. Apply log transformation before mapping to brightness values to reveal structure across the full range. Remember that your depth map resolution directly impacts the final image detail. Higher resolution depth maps allow the AI model to generate more detailed rock formations and terrain features, though they require more processing time and memory.
How Do You Set Up ComfyUI for SVG to Mountain space Generation?
ComfyUI provides the most flexible and powerful platform for SVG to mountain space conversion into photorealistic mountain imagery, but the initial configuration requires specific nodes and models arranged in a precise workflow structure. Getting this SVG to mountain space setup right determines whether your results look like professional space photography or obvious AI artifacts.
Essential Node Configuration
Start with a Load Image node to import your depth map PNG. This connects to a ControlNet preprocessor node specifically the Depth Preprocessor or Midas Depth Estimator node. While your input is already a depth map, running it through the preprocessor normalizes the values and ensures compatibility with ControlNet models. The preprocessor output feeds into the ControlNet Apply node, which combines depth conditioning with your text prompts.
Your text encoding nodes require careful prompt engineering. The positive prompt should describe your desired mountain space in detail such as "dramatic alpine mountain range at sunset, snow-capped peaks, rocky terrain, professional space photography, golden hour lighting, photorealistic, 8k resolution." The negative prompt eliminates common AI artifacts with terms like "blurry, low quality, distorted, cartoonish, flat lighting, oversaturated, watermark." These encoded prompts connect to your KSampler node alongside the ControlNet conditioning.
Model Selection Strategy
The checkpoint model you choose dramatically affects the stylistic outcome. Realistic Vision V5 excels at photorealistic natural scenes with accurate lighting and texture. DreamShaper produces more artistic interpretations with enhanced colors and dramatic atmosphere. For specific space focus, Epic Realism or LandscapesXL checkpoints trained on mountain photography datasets yield superior terrain detail and realistic geological features.
Load your chosen checkpoint through a Load Checkpoint node. Set the sampler to DPM++ 2M Karras or Euler A for spaces, as these samplers handle large-scale composition better than others. Configure steps between 25-40 depending on quality requirements. CFG scale around 7-9 provides good prompt adherence without over-processing. The seed value should remain fixed during testing so you can compare parameter adjustments fairly, then randomize for final generation variety.
Free ComfyUI Workflows
Find free, open-source ComfyUI workflows for techniques in this article. Open source is strong.
Multi-Pass Refinement Workflow
Professional results often require a two-stage process. Generate an initial image at 512x768 or 768x1024 resolution with your depth-controlled workflow. Feed this intermediate result into an img2img workflow using the same or a refined checkpoint. Set denoising strength to 0.3-0.5 to add detail without losing the depth-guided composition. This second pass enhances texture detail in rock faces, improves lighting consistency, and eliminates any remaining artifacts from the first generation.
For maximum quality, add an upscale node using models like 4x-UltraSharp or ESRGAN. This scales your refined image to final presentation resolution while maintaining detail sharpness. Some workflows include a final detailing pass at high resolution with very low denoising strength around 0.15 to add photographic grain and micro-detail that sells the realism.
Troubleshooting Common Issues
If your generated mountains don't match the depth map topology, increase the ControlNet strength parameter above the default 1.0, trying values up to 1.5. Conversely, if the image looks too constrained by the depth map with unnatural rigidity, reduce strength to 0.7-0.9 for more artistic interpretation. Black regions in your depth map sometimes generate as sky or void rather than low valleys. Add a color adjustment node to shift your depth map from pure black-white to dark gray-white, ensuring all values represent terrain rather than empty space.
Repeated patterns or tiling artifacts come from the AI model trying to fill large uniform areas. Add subtle noise to flat regions of your depth map, or include prompt terms like "varied terrain, diverse rock formations" to encourage variation. While this ComfyUI workflow offers complete control, platforms like Apatero.com package these complex node arrangements into simplified interfaces where adjusting sliders handles the underlying parameter tuning without requiring node-level expertise.
What Advanced SVG to Mountain space Techniques Create More Realistic Results?
Moving beyond basic SVG to mountain space conversion, advanced techniques layer additional control mechanisms and refinement passes that separate amateur experiments from professional-grade SVG to mountain space results that could pass for aerial photography.
Multi-Layer Depth and Control
Professional terrain generation uses multiple ControlNet inputs simultaneously. Combine your primary depth map with a normal map that encodes surface angle information, helping the AI understand which faces should catch light versus remaining in shadow. Edge detection maps highlight ridgelines and cliff faces, ensuring these critical features remain sharp rather than blurred. Create a zone mask that designates regions for snow coverage, rocky exposure, or vegetation, feeding this through a segmentation ControlNet to guide texture placement.
In ComfyUI, this requires stacking multiple ControlNet Apply nodes with different preprocessor types. Assign relative weights to each control input. Depth might carry 1.0 weight for primary topology, while normal maps use 0.6 weight for subtle lighting guidance and edge maps use 0.4 weight for detail preservation. This multi-modal conditioning produces results that respect your data topology while adding photographic realism the AI learned from training data.
Atmospheric and Lighting Enhancement
Real space photography includes atmospheric perspective where distant mountains fade to blue-gray haze. Most AI models handle this automatically, but you can enhance the effect through careful prompting. Include terms like "atmospheric haze, distant mountain layers, aerial perspective, depth of field" to trigger this behavior. Specify lighting conditions precisely such as "late afternoon side-lighting creating long shadows across rock faces" rather than generic "good lighting" prompts.
Season and weather dramatically affect mountain appearance. Generate the same depth map with prompts for summer conditions showing exposed rock and sparse vegetation, autumn with golden foliage at lower elevations, winter with heavy snow coverage, or stormy conditions with dramatic cloud formations. Each variation tells a different story while maintaining identical topology. Some workflows use seasonal LoRA models trained on specific mountain conditions to strengthen these thematic elements beyond what base checkpoints provide.
Texture Detail Enhancement
Zoom-level appropriate detail matters for believable results. Wide establishing shots should show overall form with subtle texture, while closer views need visible boulder detail, rock stratification, and surface roughness. Control this through resolution scaling and detail-focused secondary passes. Generate your initial image at moderate resolution, then use a tiled upscale workflow that processes overlapping regions at high detail, ensuring each section receives full model attention rather than treating the whole image as a thumbnail.
Want to skip the complexity? Apatero gives you professional AI results instantly with no technical setup required.
Directional texture alignment prevents the "painted on" look that plagues some AI spaces. Real rock faces show stratification layers running at angles determined by geological formation. Include prompt terms like "stratified rock layers, natural geological formation, sedimentary rock structure" to encourage this realism. For volcanic peaks, specify "igneous rock, basalt formations, columnar jointing" instead of generic "rocky mountain" descriptions.
Color Grading and Post-Processing
Raw AI generations often exhibit color balance issues or lack the tonal consistency of professional photography. Export your generated image and apply color grading through photo editing software or ComfyUI color adjustment nodes. Real mountain photography typically shows cooler tones in shadows and warmer highlights, particularly during golden hour. Apply split-toning with cool blues in shadows and warm oranges in highlights to enhance this natural look.
Contrast curve adjustments bring out detail in midtones while preventing blown highlights on snow or crushed shadows in deep valleys. Add subtle vignetting to draw attention toward central peaks. Professional space photos often include a small amount of grain to break up perfectly smooth AI-generated gradients. A light texture overlay at 5-10 percent opacity adds this photographic quality without introducing obvious noise.
For users who want these advanced techniques without manual implementation, Apatero.com includes pre-configured enhancement workflows that automatically apply multi-pass refinement, appropriate color grading, and detail enhancement based on your chosen style preset.
What Are the Practical Applications Beyond Art Projects?
While creating beautiful mountain spaces from data visualizations satisfies creative impulses, this technique solves concrete problems across professional domains where visual communication, world-building, and data presentation intersect.
Scientific and Educational Visualization
Researchers presenting seismic data transform earthquake magnitude charts into literal shaking spaces where viewers immediately grasp the intensity variations across time or geography. Climate scientists convert decades of temperature anomaly data into mountain ranges showing the growing peaks of warming trends. This metaphorical visualization communicates urgency more effectively than abstract line graphs for general audiences.
Educational content creators use topographical data from real mountain ranges, converted through SVG elevation profiles, to generate consistent reference imagery for geography courses. Students studying the Himalayas see photorealistic views generated from actual elevation data, ensuring the visual materials accurately represent the terrain while remaining cost-effective compared to licensing professional photography.
Game Development and Virtual Environments
Game designers creating open-world environments start with gameplay-relevant elevation profiles that ensure traversable paths, strategic viewpoints, and balanced challenge curves. Export these design sketches as SVG, convert to depth maps, and generate conceptual environment art that shows exactly how the designed topology appears in-game. This rapid prototyping approach validates level design decisions before committing expensive 3D modeling resources.
Virtual production and film pre-visualization benefit from generating location scouting imagery based on desired story beats. A script calls for a mountain pass narrowing between two peaks at a specific dramatic moment. Sketch the required elevation profile, generate the space, and present this to directors and cinematographers as a concrete visual reference for the needed location characteristics.
Marketing and Brand Storytelling
Corporate annual reports transform financial performance data into heroic mountain spaces where the company literally climbs toward success. This memorable visual metaphor makes dry financial reports more engaging while maintaining data accuracy. Product launch presentations show adoption curves or market penetration metrics as growing mountain ranges that convey momentum and achievement.
Real estate developers create compelling visualizations of mountain property views by starting with actual topographical survey data. Convert elevation profiles from property boundaries into realistic renders showing exactly what buyers will see from their future homes. This accuracy-focused visualization prevents the common disconnect between property marketing imagery and actual delivered views.
Earn Up To $1,250+/Month Creating Content
Join our exclusive creator affiliate program. Get paid per viral video based on performance. Create content in your style with full creative freedom.
Music and Audio Visualization
Album artwork increasingly features space visualizations of the actual audio waveforms from songs. This creates an authentic connection between visual and sonic experience. Music producers export audio as SVG waveform data, generate mountain spaces that literally represent the sound topology, then use these as single covers or concert visuals. Festival organizers create stage backdrops showing the waveform-as-mountain for the performing artist's signature track.
Podcast creators generate unique episode artwork by converting audio waveforms into space imagery, providing visual variety across episodes while maintaining a consistent style that reinforces brand identity. Each episode's unique audio signature produces a distinct but related mountain scene.
How Do Different AI Models Compare for This Technique?
The choice of underlying AI image generation model significantly impacts the aesthetic style, realism level, and controllability of your mountain spaces. Understanding each model's strengths helps you select the appropriate tool for your specific output requirements.
Stable Diffusion Variants
Standard Stable Diffusion 1.5 with ControlNet depth conditioning produces acceptable results but often requires extensive prompt engineering and multiple refinement passes. The model's training on diverse image types means it understands mountains conceptually but lacks specialized knowledge of geological formations and space photography conventions.
Stable Diffusion XL improves resolution capability and composition quality significantly. spaces generated through SDXL show better understanding of atmospheric perspective, more consistent lighting, and superior detail in rock textures. The higher base resolution reduces the need for separate upscaling workflows. However, SDXL requires more VRAM and longer processing time, making it impractical for rapid iteration without powerful hardware.
Specialized space checkpoints like Realistic Vision or Epic Realism, fine-tuned specifically on mountain photography datasets, produce dramatically better results with less prompt specificity. These models inherently understand that mountain scenes should include realistic geology, appropriate vegetation distribution, and photographic lighting. Your depth map control combines with this embedded knowledge to generate convincing terrain without fighting against the model's training.
Alternative AI Platforms
Midjourney handles space generation beautifully from text prompts but lacks the precise ControlNet depth control needed for this technique. You can describe mountains in detail, but you can't dictate exact topology from your source data. This makes Midjourney suitable for artistic interpretation inspired by data rather than accurate topology preservation.
DALL-E 3 similarly produces stunning space imagery but without depth conditioning support in the public interface. The results are artistically impressive but don't maintain the specific peak-valley relationships from your source SVG data. For projects where aesthetic quality matters more than topological accuracy, these prompt-only platforms suffice.
Runway Gen-2 and similar video-focused AI models open fascinating possibilities for animated flyovers of your data-driven mountains. Generate a sequence of depth maps representing data changes over time, then create video showing the mountain range morphing as values shift. This animated approach communicates temporal data changes more effectively than static images.
Quality vs Speed Tradeoffs
Fast generation models like LCM LoRA or Turbo variants produce results in 4-8 steps rather than 25-40, enabling real-time previewing as you adjust parameters. Quality suffers slightly with less refined details and occasional artifacts, but the speed advantage matters during experimentation. Use fast models for testing prompts and compositions, then switch to full-quality models for final renders.
Cloud-based services like Apatero.com optimize this tradeoff by using fast preview generations during interactive editing, automatically switching to high-quality models for final export. This gives you fast feedback without sacrificing ultimate output quality. If you're interested in AI video generation from your space images, check out our Wan 2.2 ComfyUI video generation guide.
Model Memory Requirements
Standard SD 1.5 models run comfortably on 8GB VRAM, making them accessible on consumer GPUs like RTX 3060. SDXL requires 12GB minimum for reasonable generation speed, pushing many users toward RTX 3090 or 4090 cards. Attention-slicing and other optimization techniques allow SDXL on 8GB cards but with significantly slower generation times that hamper experimentation.
Cloud inference through platforms offering API access eliminates local hardware requirements entirely. Services like Replicate, RunPod, or integrated platforms like Apatero.com handle the compute infrastructure while you focus on creative direction. This approach makes sense for occasional use or users without dedicated AI hardware, though per-generation costs accumulate compared to local hardware investment.
Frequently Asked Questions
Can you convert any type of line graph into mountain spaces?
Yes, virtually any line graph works for this technique including financial charts, scientific measurements, audio waveforms, or abstract artistic curves. The key requirement is that your data can be represented as a continuous line where Y-values map meaningfully to elevation. Graphs with extreme outliers may need logarithmic scaling to prevent one spike from dominating the entire terrain. Multi-line graphs require decisions about whether lines represent separate mountain ranges or should blend into a composite height field.
What resolution should your depth map be for best results?
For most applications, 1024x1024 pixel depth maps provide excellent results balancing detail and processing speed. Lower resolutions like 512x512 work for quick tests but limit fine detail in the final render. Higher resolutions like 2048x2048 or 4096x4096 enable massive prints or extreme zoom detail but require significantly more VRAM and processing time. Match your depth map resolution to your intended output use. Social media posts rarely benefit from extreme resolution, while large format prints justify the computational investment.
How long does it take to generate one realistic mountain image?
On modern consumer GPUs like RTX 4070 or higher, a single image generation at 1024x1024 resolution takes 30-60 seconds with standard Stable Diffusion models using 25-30 sampling steps. Older GPUs or SDXL models may require 2-5 minutes per generation. Multi-pass refinement workflows that include upscaling and detail enhancement can extend total time to 5-10 minutes for publication-ready results. Cloud-based services typically match or slightly exceed local generation speeds depending on server load.
Do you need programming knowledge to do this technique?
No programming is required if you use visual tools like ComfyUI's node-based interface or simplified platforms like Apatero.com. The manual approach using Inkscape for SVG processing and ComfyUI for generation involves only clicking and dragging with no code. Programming knowledge becomes valuable for automated batch processing, custom preprocessing scripts, or creating reproducible pipelines that handle hundreds of graphs. Python scripts can automate the entire workflow from raw data to finished renders without manual intervention for each conversion.
Can this technique work with real topographical elevation data?
Absolutely, this is one of the most powerful applications. Real-world elevation data from sources like USGS, SRTM, or OpenTopography comes in formats like GeoTIFF or ASCII grid that can be converted to depth map images through GIS software or Python scripts. The resulting terrain generations reflect actual mountain ranges from Earth, useful for geographic education, location scouting, or game environments based on real places. The AI adds photorealistic texture and lighting to the accurate elevation data.
What's the difference between this method and 3D terrain rendering?
Traditional 3D rendering in software like Blender creates actual geometric meshes with precise mathematical representation of every surface point. This offers complete control over camera angles, lighting, and materials but requires significant technical expertise and rendering time. The AI depth-to-image approach generates 2D images that appear three-dimensional through learned understanding of how mountains look, rather than calculating geometry. This is faster and easier but limits you to fixed viewpoints. For single images, the AI method often produces more photorealistic results faster. For animated camera moves or interactive exploration, traditional 3D rendering remains necessary.
How accurate is the topology in the final generated image?
When using appropriate ControlNet strength settings typically 1.0 to 1.5, the generated mountains closely follow your depth map topology within about 5-10 percent deviation. Peak positions, relative heights, and valley locations remain faithful to your source data. Fine details like specific rock formations are artistically interpreted by the AI rather than controlled by your input. For applications requiring exact topology representation, increase ControlNet strength and use multiple refinement passes. The technique preserves macro-topology well while adding micro-detail through AI interpretation.
Can you animate the data over time to show changes?
Yes, temporal data animations are possible by generating a sequence of depth maps representing each time point, then creating corresponding mountain images. String these frames into video using standard video editing software. The AI models maintain some consistency between similar images, though you may see variations in specific rock details between frames. For smoother results, use a fixed seed across all generations and vary only the depth map. This technique powerfully visualizes time-series data like stock prices over years or climate measurements across decades as evolving mountain spaces.
What costs are involved in using this technique?
If running locally, the only costs are your existing GPU hardware and electricity. A single generation costs fractions of a cent in power consumption. Cloud-based generation through API services typically charges $0.01 to $0.05 per image depending on resolution and model. Subscription services like Apatero.com usually offer monthly flat rates with unlimited or high-volume generation limits, making them economical for regular use. Free options exist through Google Colab notebooks running ComfyUI, though these have time limits and require technical setup.
How can you improve results that look too artificial?
Artificial-looking results usually stem from several fixable issues. Insufficient ControlNet strength causes the AI to ignore your topology data, generating generic mountains instead of your specific shape. Increase the strength parameter. Poor prompts produce generic results. Add specific descriptive terms about rock types, lighting conditions, and photographic style rather than generic "mountain space" prompts. Single-pass generation lacks detail refinement. Add an img2img second pass with low denoising to enhance realism. Finally, color grading in post-processing adds the tonal consistency found in professional photography that raw AI outputs sometimes lack.
Making Your Data Into Dramatic SVG to Mountain space
Converting SVG to mountain space imagery transforms abstract data into emotionally resonant visual experiences that communicate more effectively than traditional charts. The SVG to mountain space technique combines precise topological control from your source data with AI-learned photographic realism, producing results that are both accurate and beautiful.
The SVG to mountain space workflow from vector data extraction through depth mapping to final AI generation involves multiple steps, but each component is accessible through free tools. ComfyUI with ControlNet provides professional-level SVG to mountain space control for users comfortable with node-based workflows. Those preferring simplified approaches find platforms like Apatero.com handle the technical complexity while preserving creative control through intuitive interfaces. For VRAM optimization when running complex workflows, see our VRAM optimization guide.
Beyond artistic applications, this technique solves real visualization challenges in education, science communication, game development, and data presentation. Financial analysts, music producers, game designers, and researchers all benefit from methods that make numerical data physically tangible through space metaphor.
Start with a simple single-line graph to learn the fundamental conversion process. Export from your preferred graphing software as SVG, process into a depth map through Inkscape or Python, and generate your first mountain space through ComfyUI or a simplified platform. The immediate visual results provide satisfying feedback that motivates refinement and experimentation. For consistent results when generating multiple space variations, see our guide on character consistency techniques which applies to any repeated subject matter.
As you develop proficiency, explore advanced techniques like multi-layer control, atmospheric enhancement, and temporal animation. These methods improve your results from interesting experiments to professional-quality visualizations that could appear in publications, presentations, or commercial projects. You can also train custom LoRAs to achieve specific space styles using our FLUX LoRA training guide.
The intersection of data visualization and AI-generated imagery continues evolving rapidly. Techniques that required expert knowledge months ago now become accessible through better tools and clearer documentation. Your line graphs contain hidden mountain ranges waiting for the right conversion process to reveal their dramatic potential.
Ready to Create Your AI Influencer?
Join 115 students mastering ComfyUI and AI influencer marketing in our complete 51-lesson course.
Related Articles

10 Best AI Influencer Generator Tools Compared (2025)
Comprehensive comparison of the top AI influencer generator tools in 2025. Features, pricing, quality, and best use cases for each platform reviewed.

5 Proven AI Influencer Niches That Actually Make Money in 2025
Discover the most profitable niches for AI influencers in 2025. Real data on monetization potential, audience engagement, and growth strategies for virtual content creators.
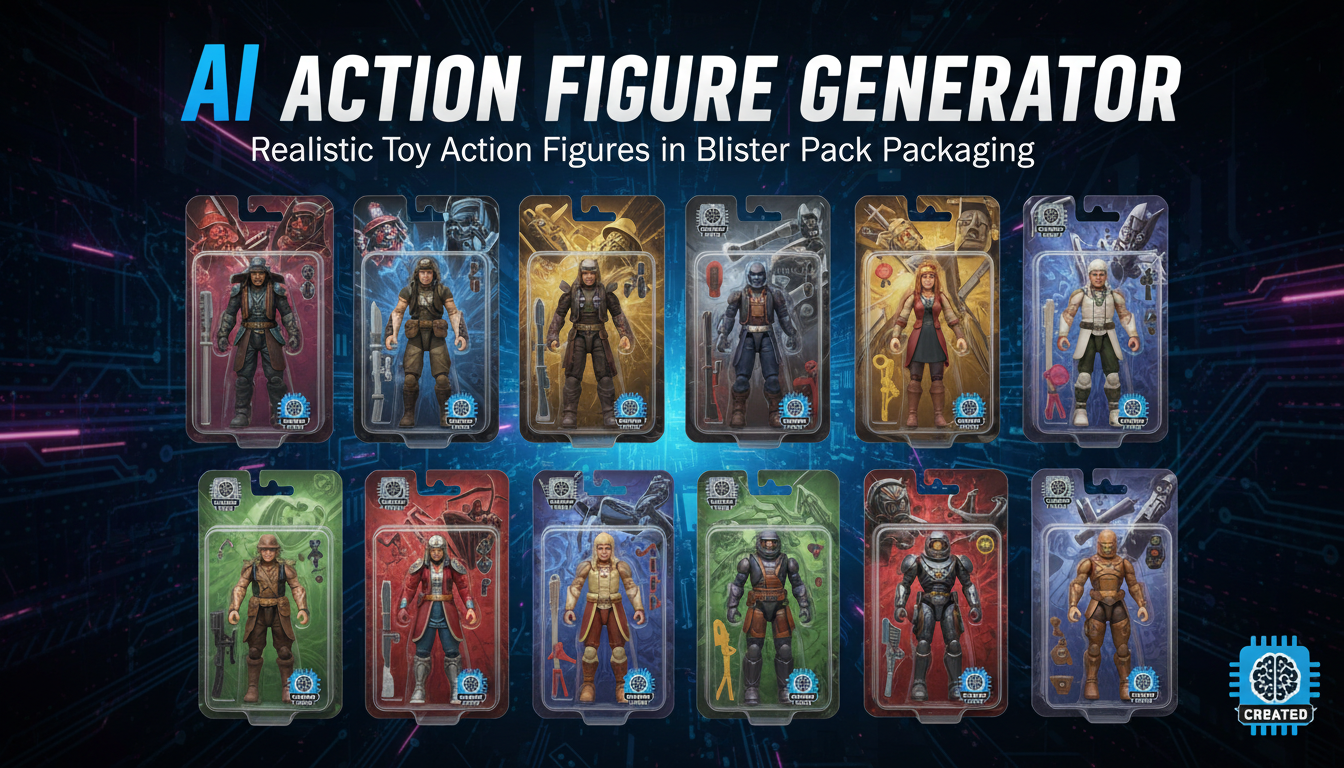
AI Action Figure Generator: How to Create Your Own Viral Toy Box Portrait in 2026
Complete guide to the AI action figure generator trend. Learn how to turn yourself into a collectible figure in blister pack packaging using ChatGPT, Flux, and more.